How can we help you?
Events' Demand - Linear View
The linear view of the impact on demand and related dates is very useful to see the evolution of demand over a given month. In this view you can see, in graphic format, the variation of the impact of each event on the demand of your property.
You can access this view from the menu Configuration-> General -> Events. On the top right, there are two buttons, one to access the calendar view and the other to access the linear view.
In the upper navigation bar you can:
- Change related date: this allows you to change the natural correlation of dates with the date you think is most convenient.
- Add event and configure the impact you foresee it may have on the demand of your property.
- Change the display between the annual view and the monthly view.
- Browse through different months or years.
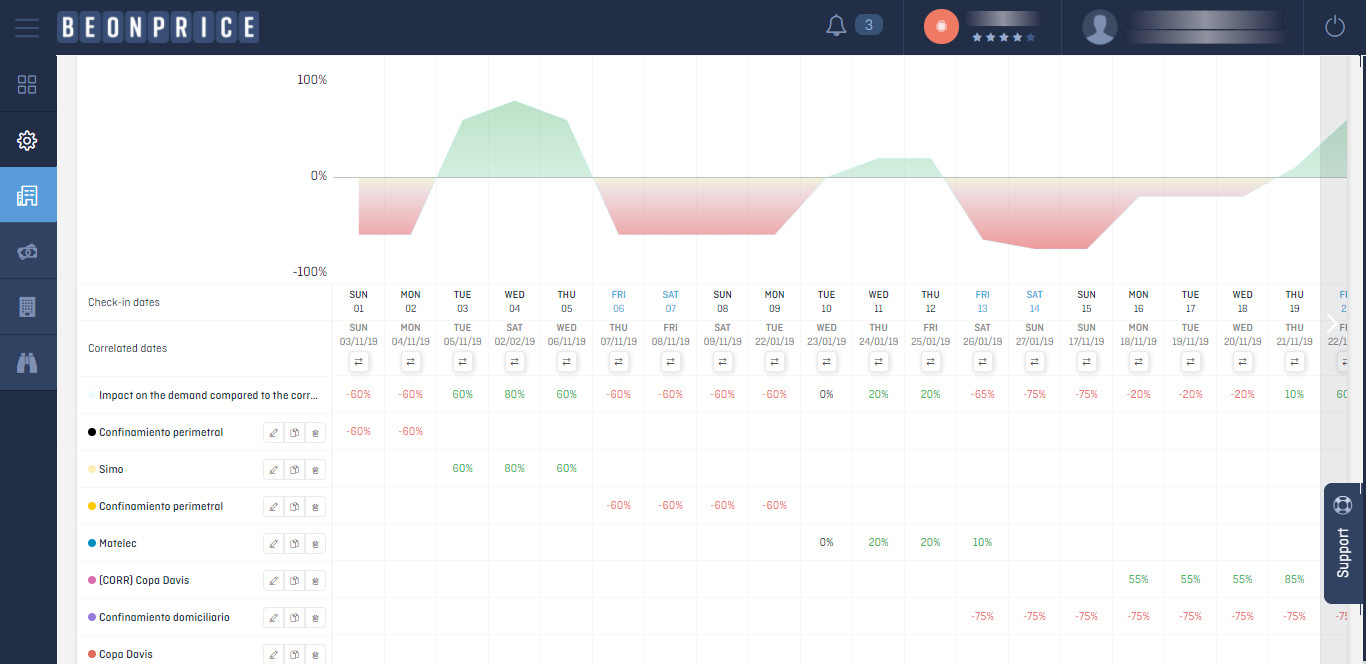
Graphics
- Horizontal axis: the check-in dates of the month you are viewing
- Vertical axis: the change in demand with respect to the related date.
- 0 represents the demand you had at your hotel on the related date. The impact will be represented with values between -100% and 300%.
- In the graph, the total sum of impacts of the events on each date is represented with a shaded area. When the expected demand is lower than the related date, it will be represented in red, and if higher, in green.
- By clicking on each item in the legend, you can see the specific impact of each event, represented by a line in the graph.
Chart In the table each column corresponds to a check-in day of the month you are viewing. And each row with an event, in the first column you can see the name and colour of the event, as well as the edit, copy and delete buttons for each event.
Note: on dates where there is an event but no impact set up you will see a dash “-”. On days with an increase in demand with respect to the related date, the figure will be shown in green and on days with a decrease in demand with respect to the related date, the figure will be shown in red.