¿Cómo podemos ayudarte?
Reporting: Hotel overview
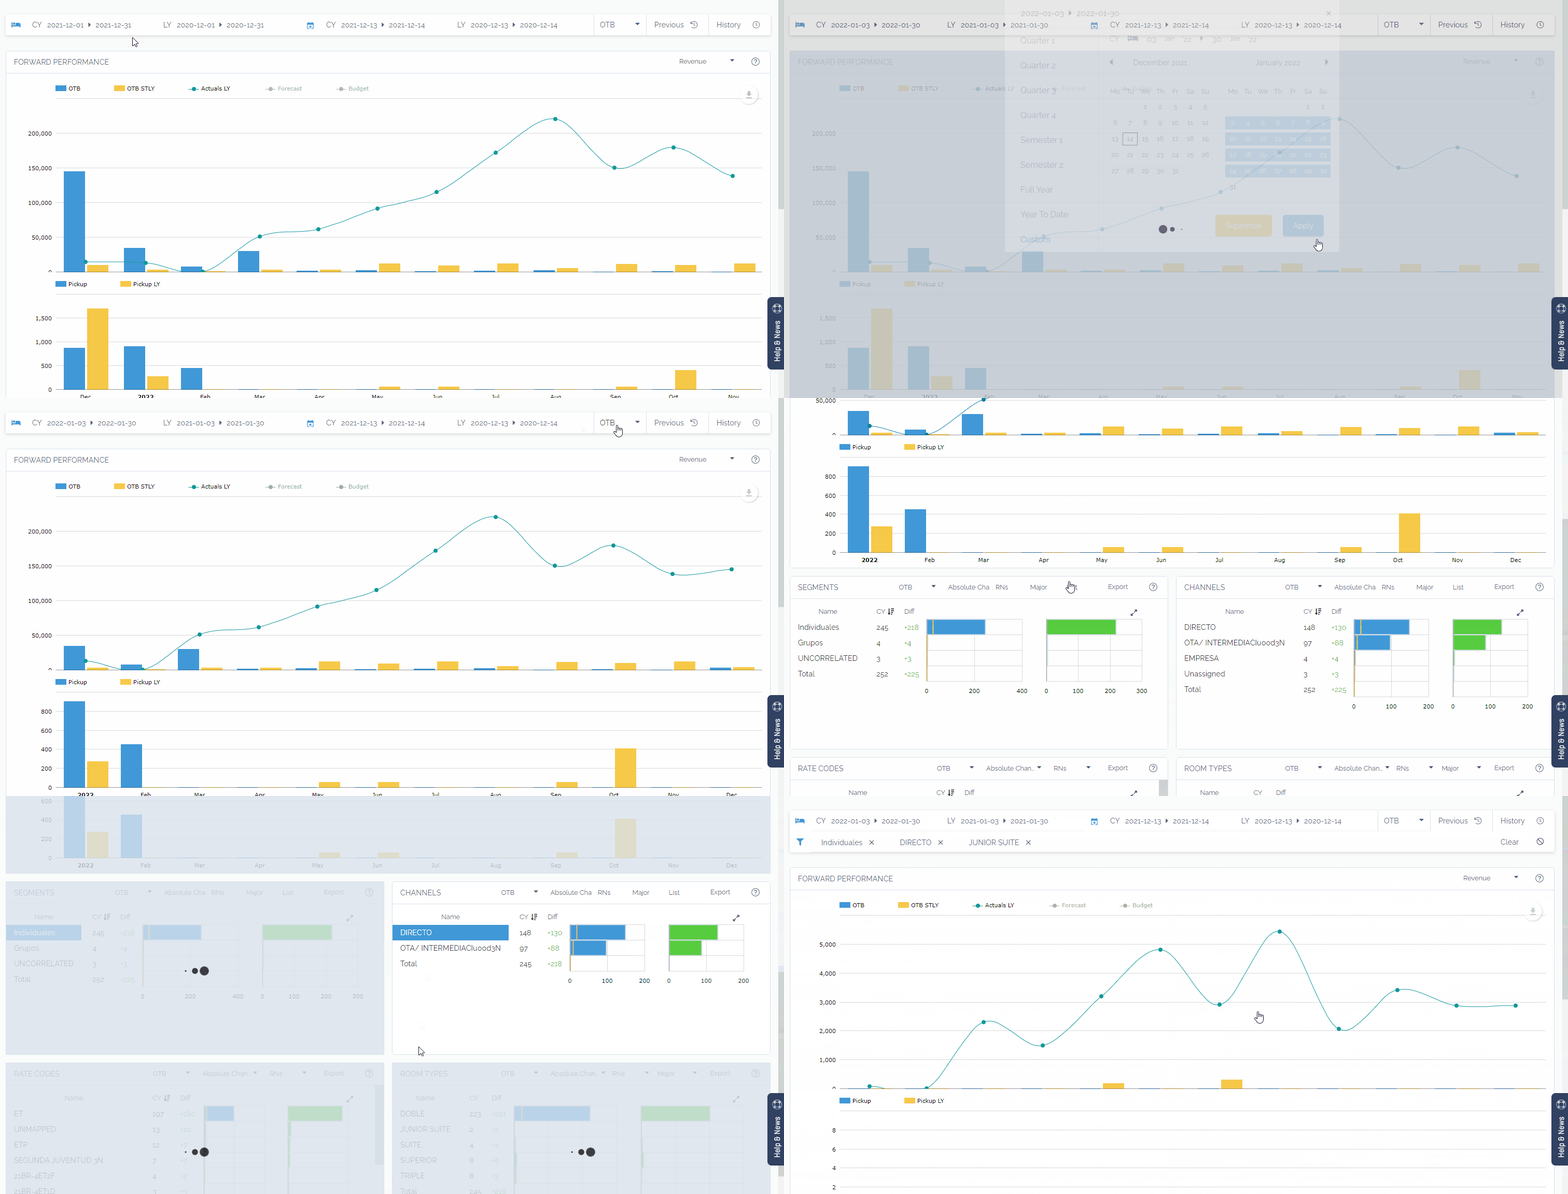
 The hotel overview report can help you focus your strategy on the months you need it most. The graphs in this report provide you with performance data for your hotel for each month.
- In the bar above you can select the check-in dates and booking dates you want to consult.
- Once the dates have been selected, clicking on the Apply button will reload the graphs with the data corresponding to those dates.
- On the graphs you can click on the data you want to visualize (OTB, OTB STLY, LY, Forecast or Budget).
- All the graphs are related, clicking on any element of them will automatically filter the rest of the graphs. For example, by clicking on a segment you can see in the rest of the charts the data of the selected segment.
Remember: the History and previous buttons allow you to quickly go back to retrieve previously performed queries.