¿Cómo podemos ayudarte?
Reporting: Market Segmentation
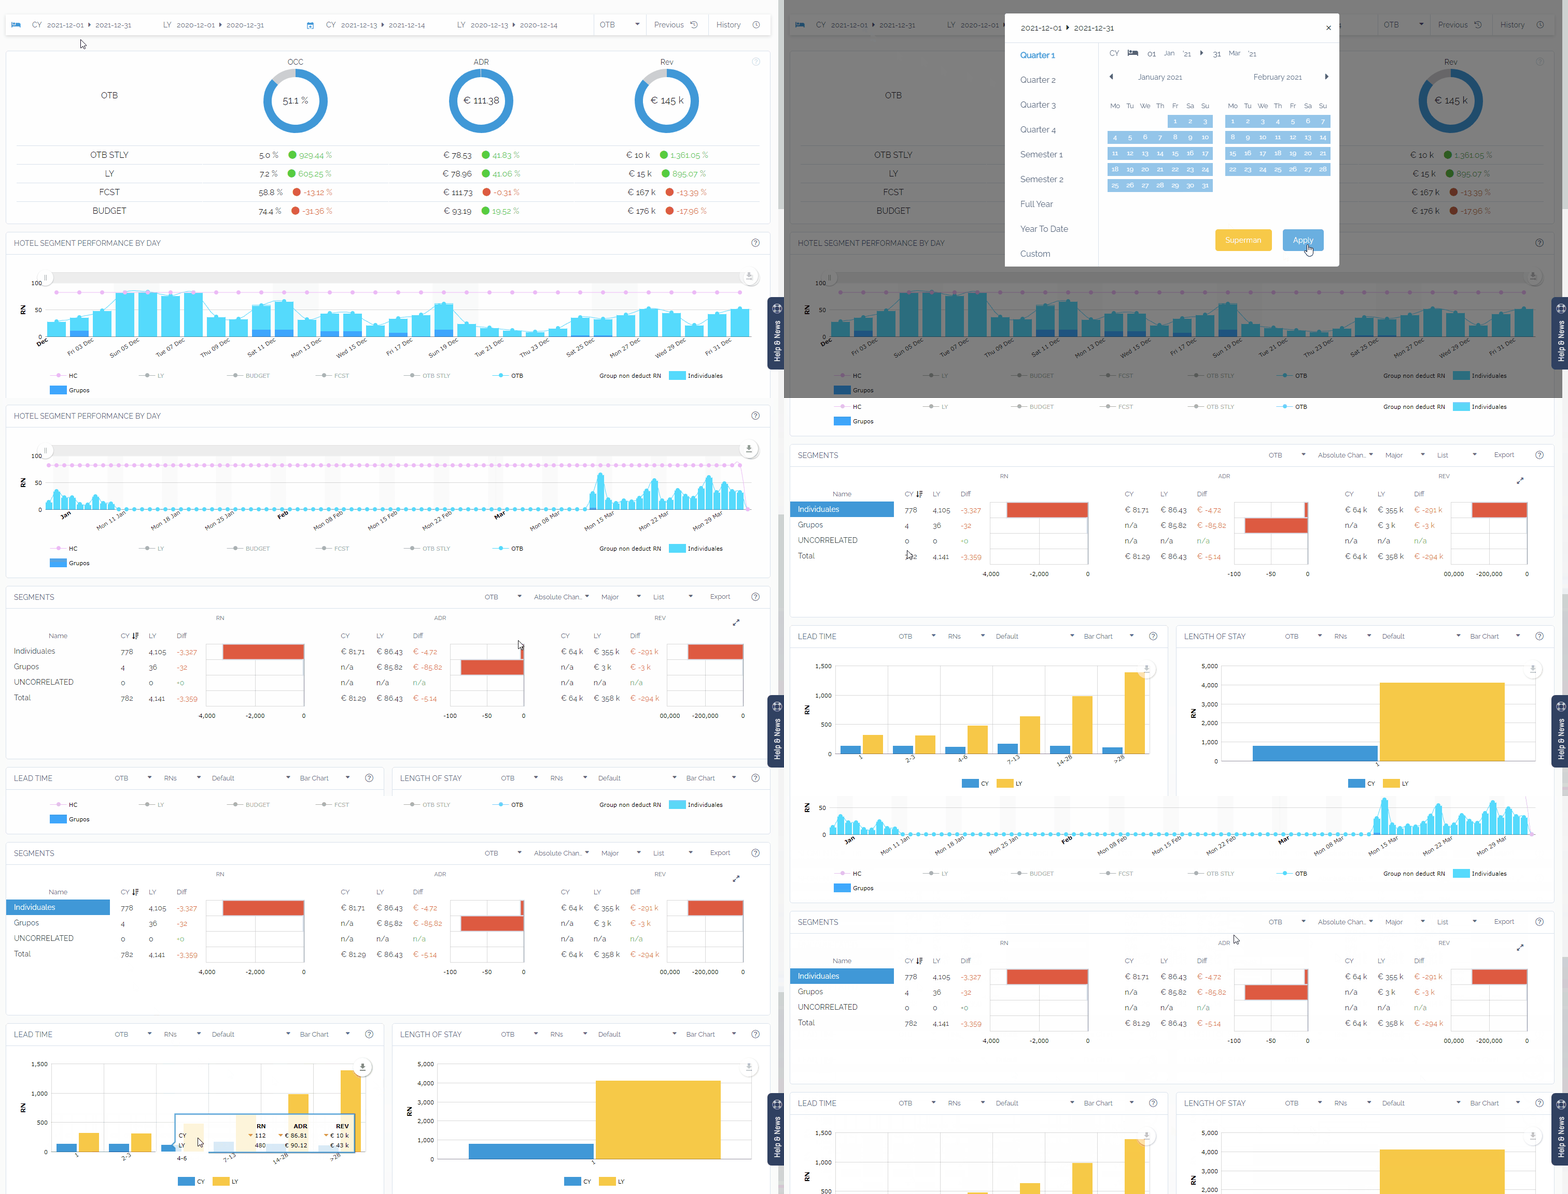
 Market segmentation will help you analyze the main performance KPIs in a segmented way.
- In the top bar you can select the check-in dates and booking dates you want to consult.
- Once the dates have been selected, clicking on the Apply button will reload the graphs with the data corresponding to those dates.
- The “Lead time” graph shows you the number of days before the arrival day that a guest booked a room.
- The “Length of stay” graph will let you know the length of stay by segment. It gives you the information you need to optimize inventory and establish the right strategies.
- All graphs are related, clicking on any element of them automatically filters into the rest of the graphs. For example, by clicking on a market you can see in the rest of the charts the data of the selected channel.
Remember: the History and previous buttons allow you to quickly go back to retrieve previous queries.