¿Cómo podemos ayudarte?
Reporting: Rate plan analysis

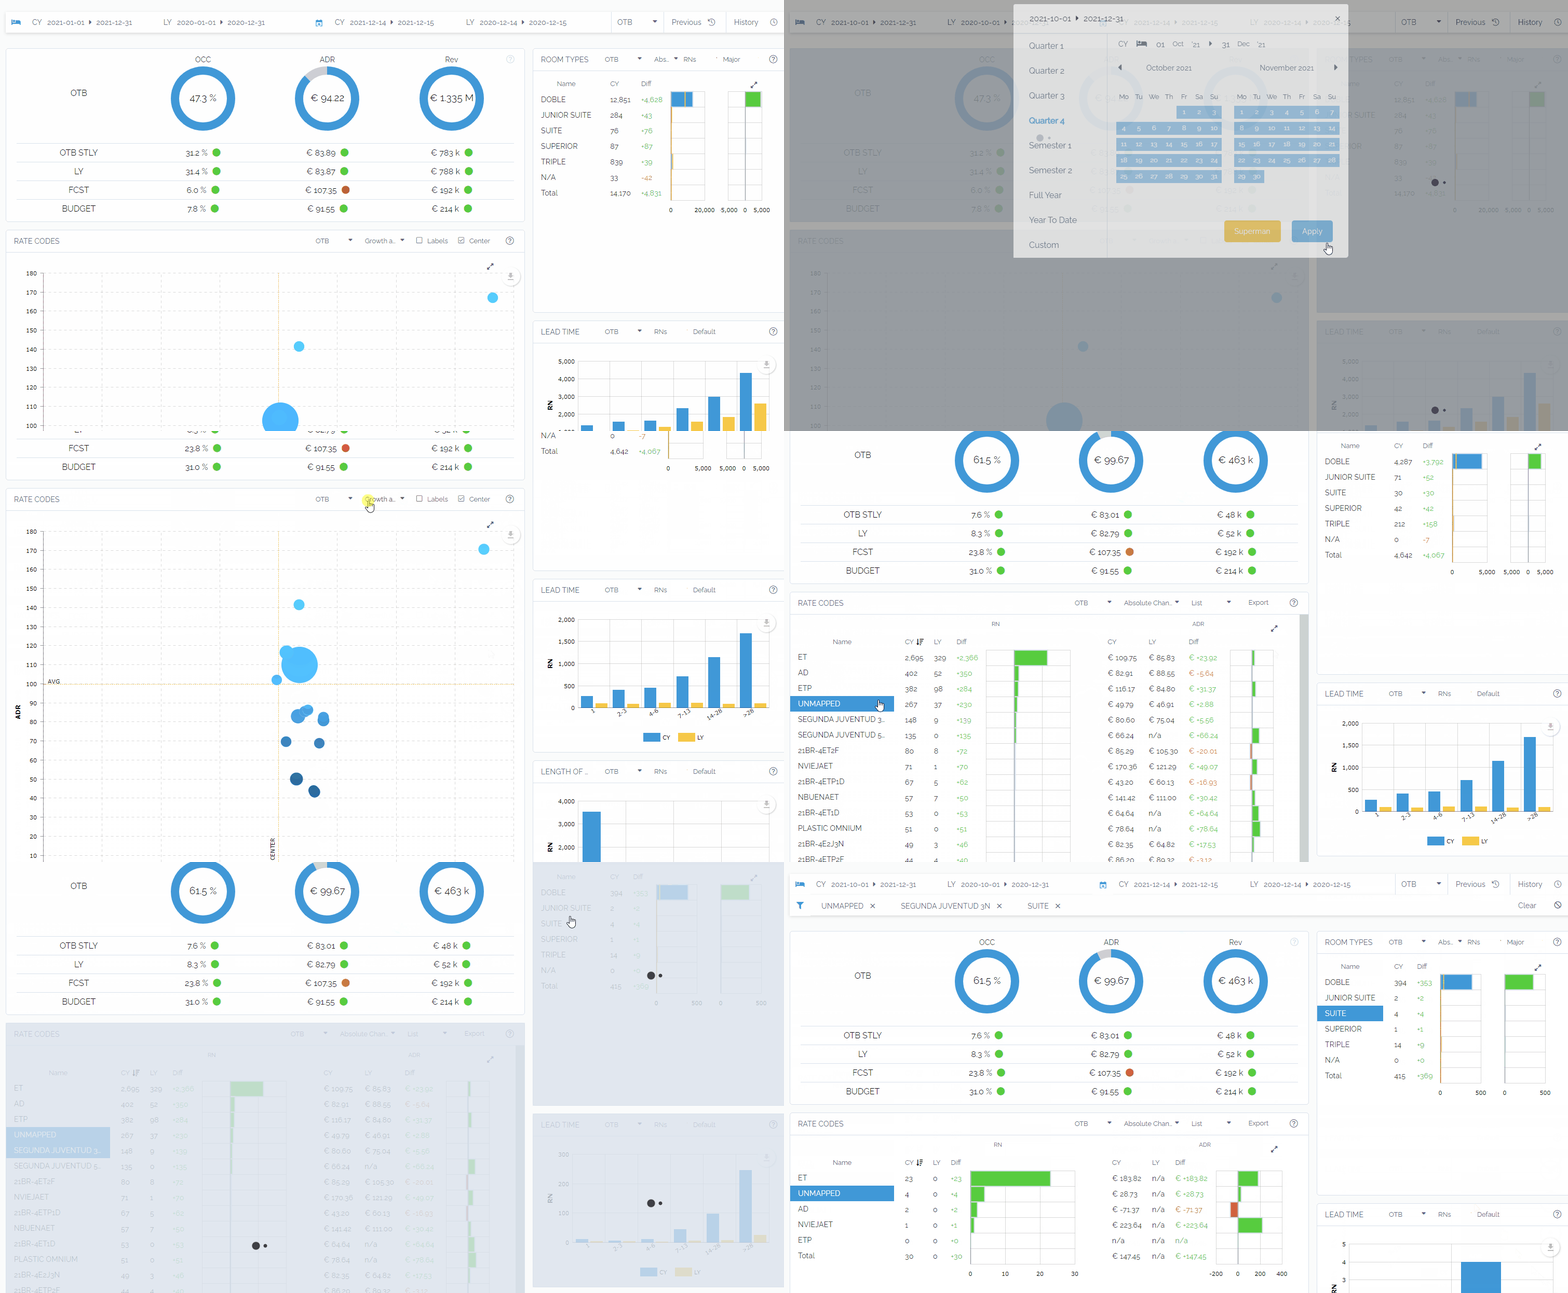
The rate plan analysis report will help you analyze the main performance KPIs both by room type and by rate plan.
- In the top bar you can select the check-in dates and the booking dates you want to consult.
- Once the dates have been selected, clicking on the Apply button will reload the graphs with the data corresponding to those dates.
- The Rate code graph allows you to make a growth analysis. The graph displays the rate codes according to ADR and the % growth compared to the comparison period. The goal is to grow the highest value accounts, which will be located in the upper right corner of the graph. The larger the bubble, the higher the volume booked by that rate code. Therefore, ideally, the larger bubbles should also be located in the upper right corner.
- The “Lead time” graph shows you the number of days before the arrival day that a guest books a room.
- The “Length of stay” graph will let you know the length of stay by segment. It gives you the information you need to optimize inventory and establish the right strategies.
- All graphs are related, clicking on any element of them automatically filters into the rest of the graphs. For example, by clicking on a room type you can see in the rest of the graphs the data of the selected room type.
Remember: the History and previous buttons allow you to quickly go back to retrieve previously performed queries.