¿Cómo podemos ayudarte?
How to take tactical decisions?
Any Revenue Manager or Commercial Manager faces the daily mission of making decisions.
At BEONx, we know that these decisions are not easy, especially when you first have to consult and compare thousands of data points to analyze the situation of your establishment, KPIs, competitors, the previous year’s closing, the evolution versus forecast, etc.
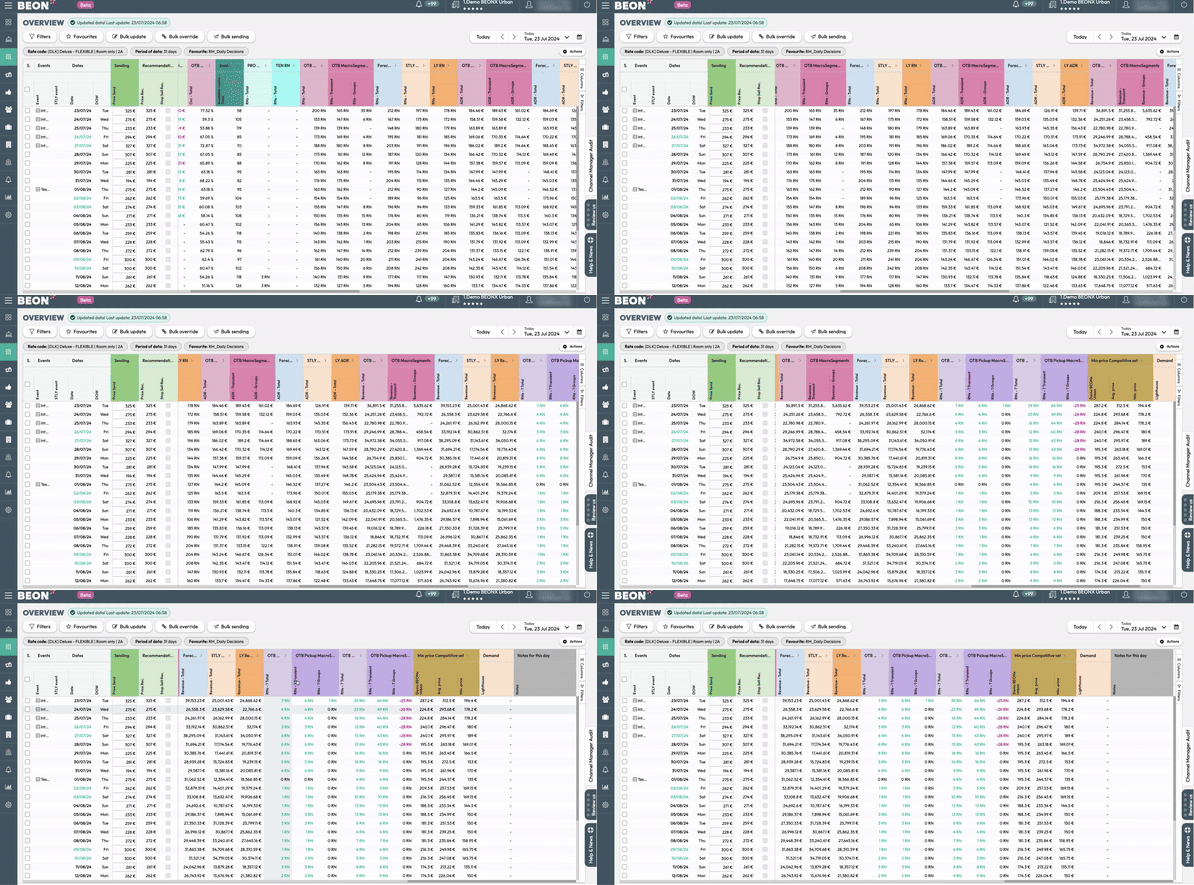
The OVERVIEW module simplifies this complex process by consolidating the main data needed for daily analysis into one table, including recommendations and the option for direct submission.
And we continue to simplify your daily tasks even further by adding data aggregation by weeks, months, or quarters. Forget about manual calculations and Excel downloads!

In this OVERVIEW table, you can:
-
Validate and make optimal decisions at a glance.
-
View, send, and compare recommendations.
-
Customize the view according to your needs or preferences.
-
See aggregated data at week, month, or quarter level.
-
Save your preferred views as favorites. Check out our article Create Your Own Favorite. We’re Here to Help!
-
Insert notes to include any additional information and ensure nothing is forgotten (promotions, strategies, etc.).
If you would like to learn how to navigate through this table, check our article How to use overview table